# Script to combine and tidy multiple Catapult Openfield 10Hz export .csv files by Mitch Henderson

library(tidyverse)
library(zoo)

# This must exactly match the folder name containing the .csv files and be in your working directory

folder_name <- "combine"

# This function will read in multiple .csv files, create a column with the file name, and parse it into it's relevant components.

read_plus <- function(flnm) {
  read_csv(flnm, skip = 8) |>
    mutate(Filename = flnm,
           without_folder = str_split(Filename, "/")[[1]][2],
           Activity = str_split(without_folder, " Export")[[1]][1],
           Player_interim = str_split(without_folder, " for ")[[1]][2],
           Player = paste0(
             str_split(Player_interim, " ")[[1]][1],
             " ",
             str_split(Player_interim, " ")[[1]][2]
             )
           ) |>
  select(-Filename,
         -Player_interim,
         -without_folder)
}

# Import all files contained within the folder specified by `folder_name` above

combine_and_tidy <-
  list.files(path = paste0(folder_name, "/"),
             pattern = "*.csv",
             full.names = T) |>
  map_df(~read_plus(.))

# Output csv into working directory

write.csv(combine_and_tidy, file = paste0(folder_name, "_tidy.csv"), row.names = F)YouTube tutorial
You can see me going through all the steps outlined here in this video with some dummy data (note that I’ve simplified the file structure in the post since recording this video so it will be a little different; both work though):
Tidy data
It’s claimed that ~80% of data analysis is on the process of cleaning and preparing the data (1). In 2014, Hadley Wickham coined the term tidy data to define a dataset structured to facilitate analysis. In the R for Data Science book’s section on tidy data, for a dataset to be tidy it has to follow these 3 interrelated rules:
- Each variable must have its own column.
- Each observation must have its own row.
- Each value must have it’s own cell.
 Following three rules makes a dataset tidy: variables are in columns, observations are in rows, and values are in cells. Image from R for Data Science by Hadley Wickham & Garrett Grolemund.
Catapult data
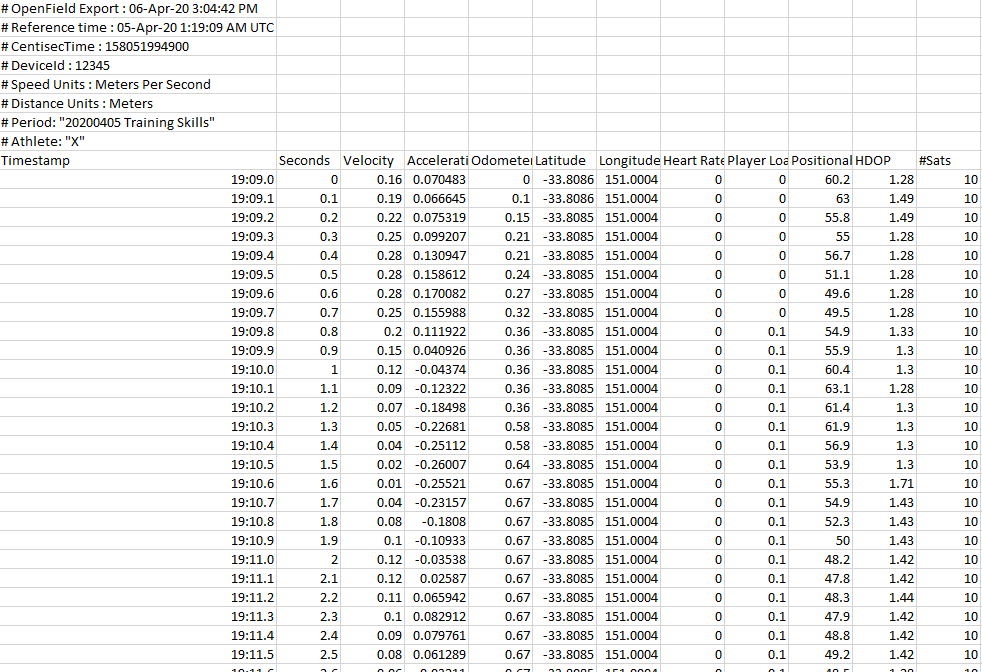
When you export 10Hz GPS data from Catapult’s Openfield software, the .csv file produced from each unit looks like this:


It isn’t great because:
- Each unit has produced it’s own
.csvfile, meaning to do any analysis using all players’ data we need to find a way to combine the files. - There are 8 rows of metadata above the actual data we’re primarily interested in, preventing us from combining in it’s current format.
Without combining all players’ data into one tidy table or “dataframe”, we can’t explore the data using the common tools like a PivotTable on Microsoft Excel or the dplyr R package.
Solution
Thankfully for us, we don’t need to manually go through each file, deleting the top 8 rows, creating new columns for the metadata like player name and match, and then copy pasting them all into the one file. The tidyverse suite of R packages can help us to largely automate these manual tasks!

I’ll explain how to do it here (and provide you with the R code), and a working example is in the YouTube video above.
This process will:
- Pull in each
.csvfile’s data within the folder you’ve referenced with thefolder_namevariable (assuming that folder is within your working directory). - Remove the 8 rows of metadata from the top of each file.
- Create new columns for player name and activity derived from the
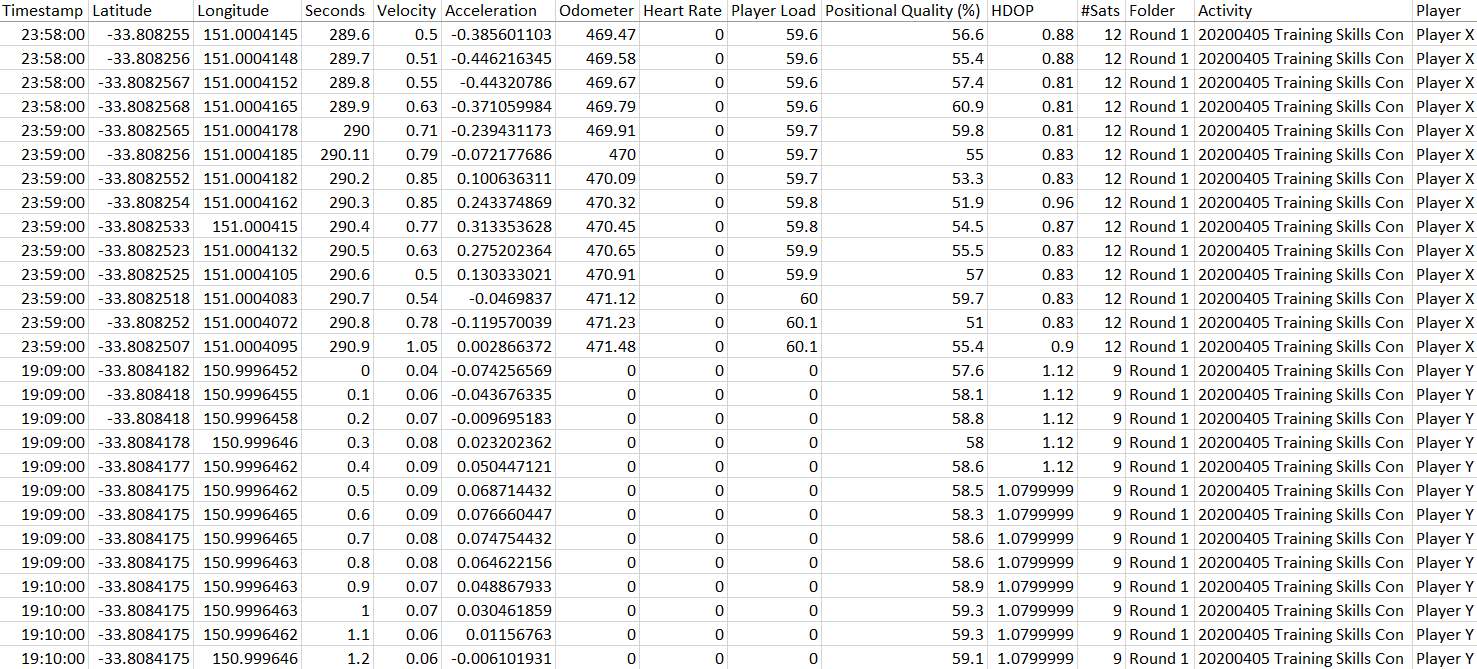
.csv’s file name generated by Openfield. - Combine all files into one dataframe.
- Export this dataframe into a new
.csvcalled “folder_name_tidy.csv” in your working directory. Where thefolder_namepart of the new file name is a folder in your working directory where your exports are stored (e.g., the name of my file below is “combine_tidy.csv” because I have my.csvfiles in a folder called “combine”). You will type in the name of this folder into the code.

Step 1
Create a folder that will contain all your folders of Openfield 10Hz exports. Name this anything you like.
This folder will need to be in your working directory when you run the code below. If you aren’t familiar with a working directory, it is just a file path on your computer that sets the default location of any files you read into R, or save out of R. Think of it like a “home” folder and you refer to all files relative to this (you can check what it’s currently set to by running getwd(). I recommend using RStudio Projects to make this process much smoother.
In my code below I’ve assigned the variable folder_name to be “combine” (the name of my folder that I will save the export files). You will need to change the folder_name variable to the folder that will contain your export files.
Step 2
Export the files you’d like to combine from Openfield without changing their filename and save them in the folder discussed in Step 1.
Some examples could be “Round 1” if you’re combining all your athletes exports from a round 1 match.
Step 3
Make sure you have R and RStudio downloaded and installed on your machine (both free!).
Open RStudio, copy and paste the code below into a script (you can create a new R script by clicking the symbol directly under ‘File’ on the top-left of the window, and selecting ‘R Script’).
Save the file as a .R file with an appropriate name (e.g. “tidy_catapult_data.R”).
Step 4
Change the folder_name variable to the exact folder name (in double quotes like is currently in the code) containing the .csv files you would like to combine and tidy.
Highlight the entire code and press Ctrl + Enter on PC or Cmd + Return on a Mac. This will run the code and produce the output .csv file in your working directory.
Done!
Now the data is in tidy format and is easy to manipulate and analyse!


Let me know if this post has helped you or if there’s anything else you’re interested in learning that I can help with. I’m keen to hear!
Keep up to date with anything new from me on my Twitter.
Cheers,
Mitch
Thumbnail from catapultsports.com.