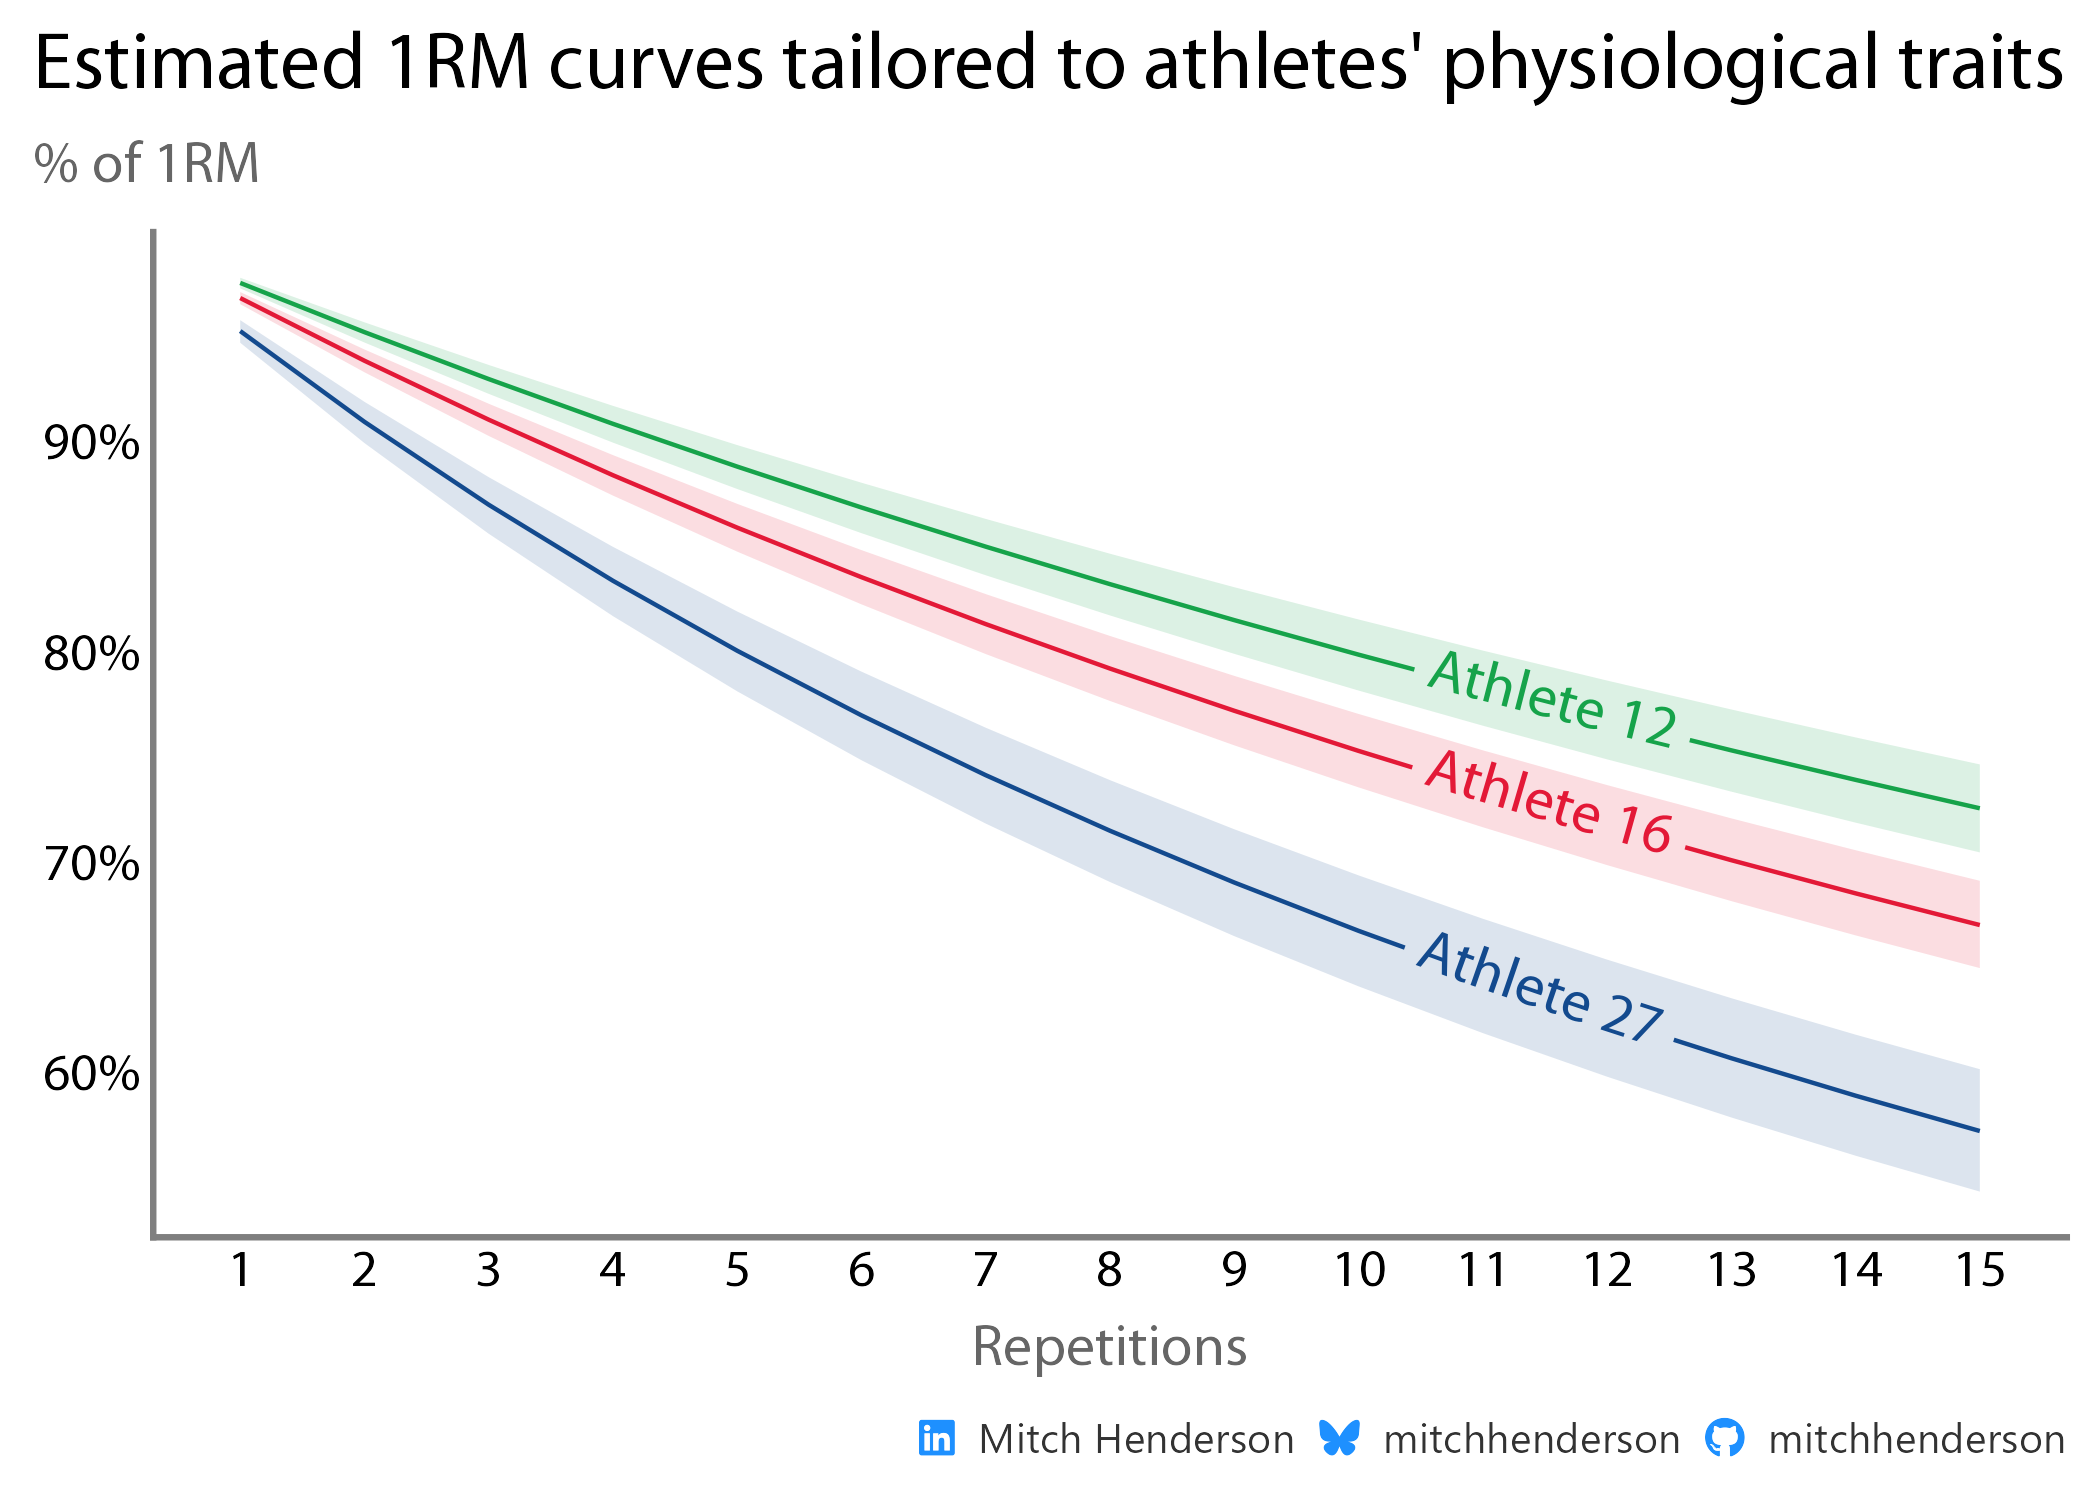
Use more of the information you have.
It depends, but Monte Carlo simulations give us a pretty good idea
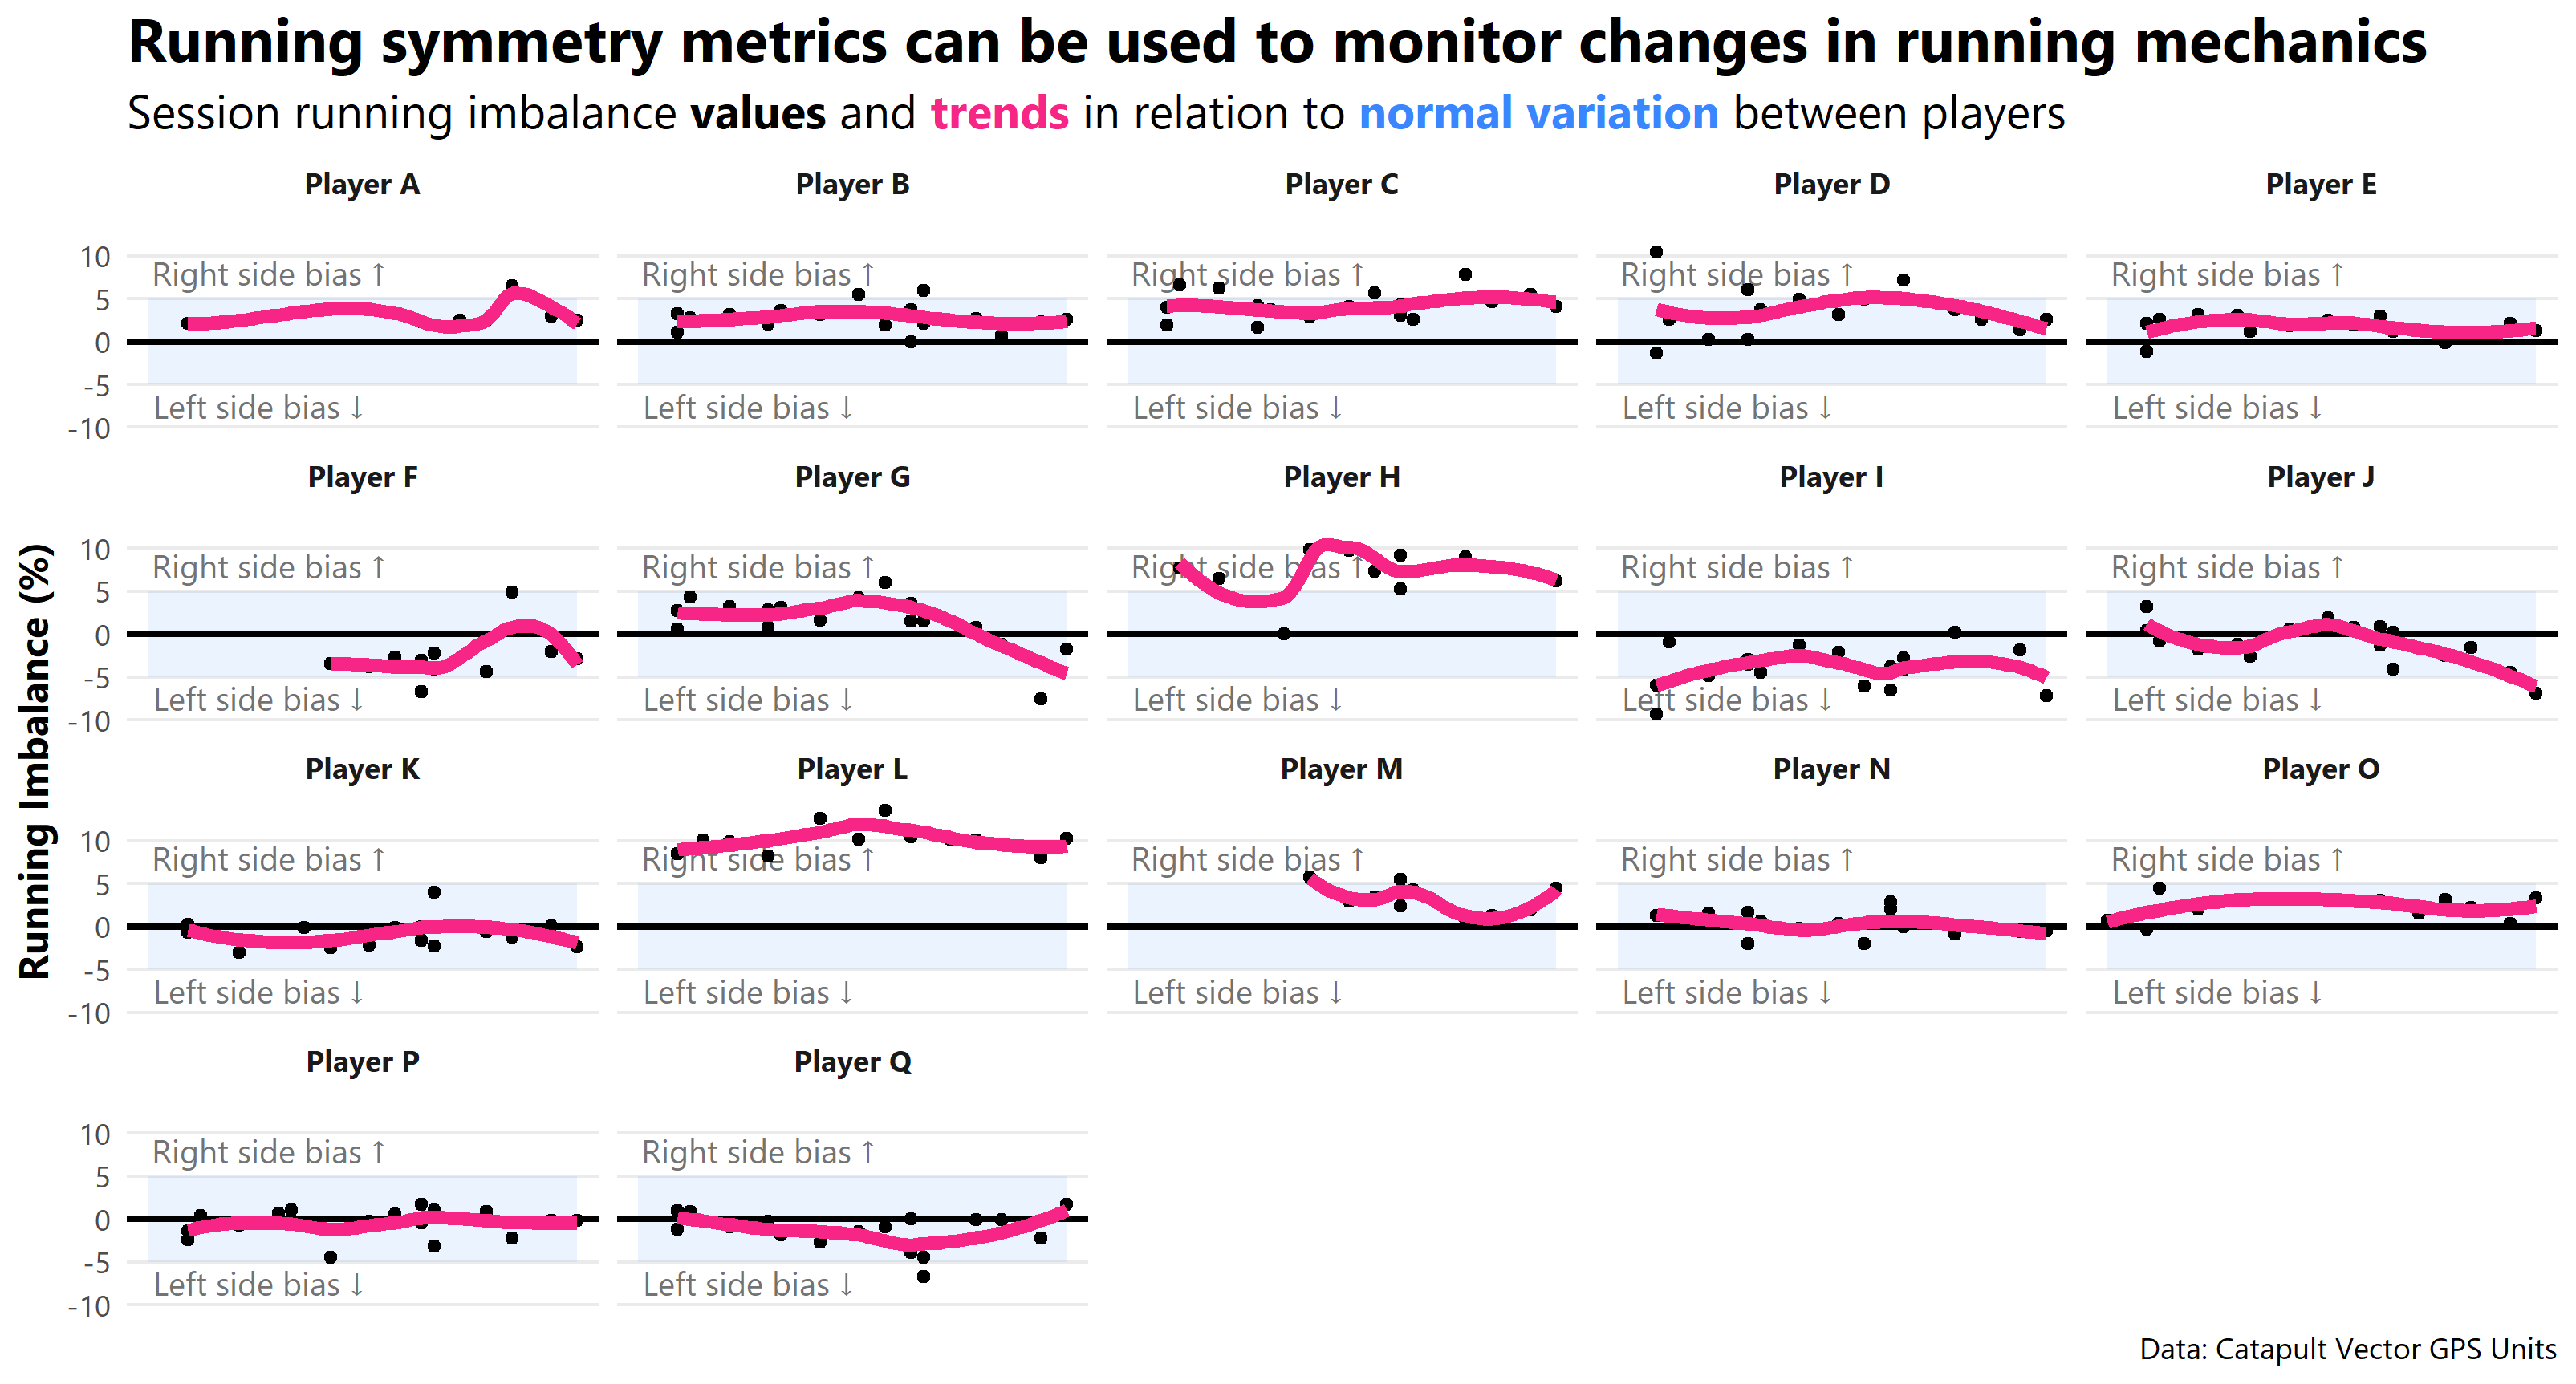
This post shows how running symmetry data can be exported from Catapult Openfield, then imported and visualised in R.
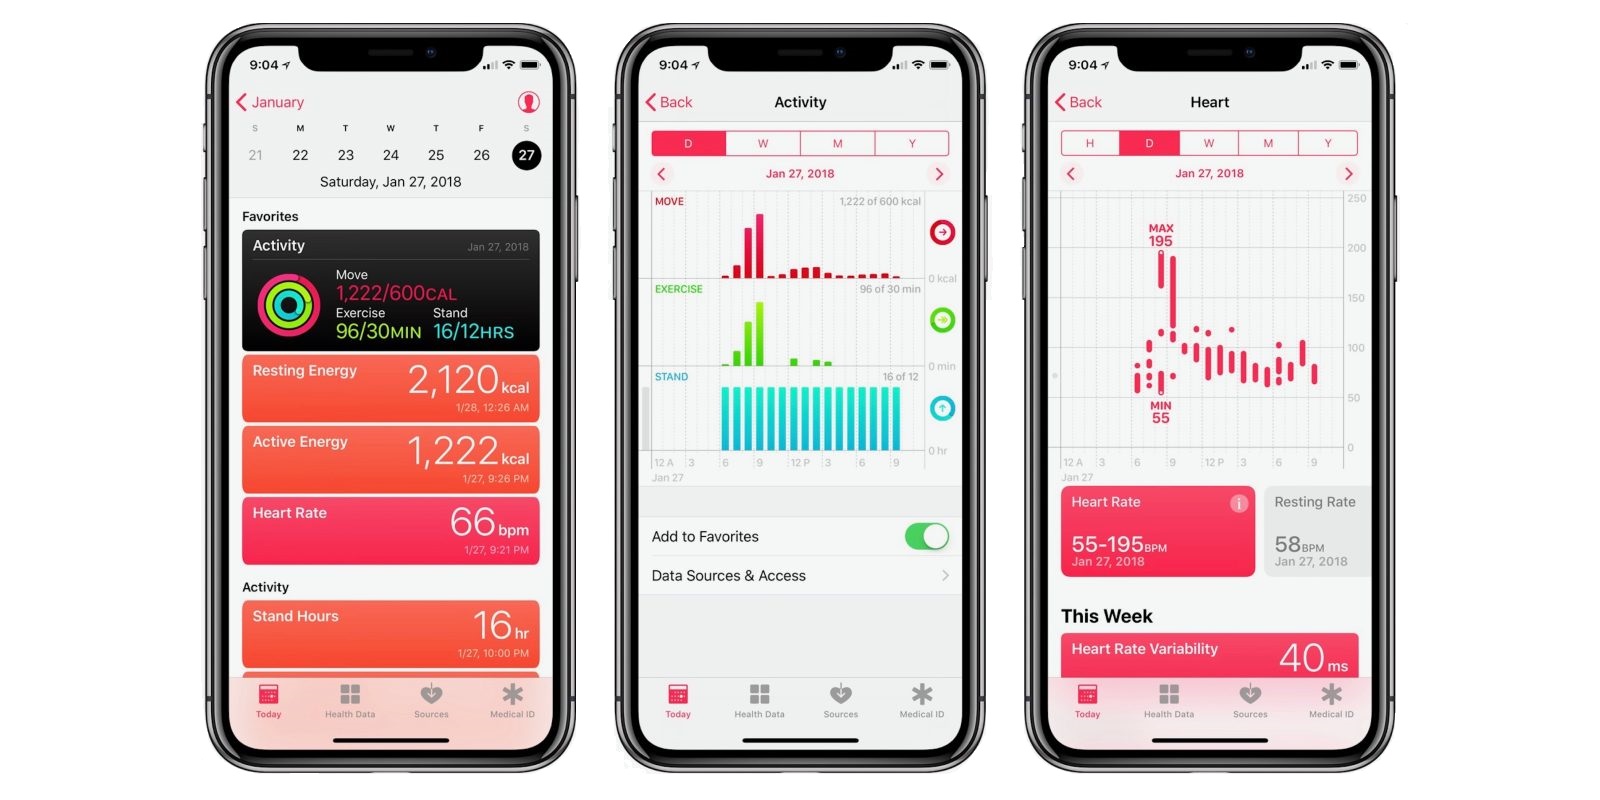
Tracking data from your Apple watch doesn’t have to stay in an app. This post shows you how it can be exported, manipulated, and visualised using R.
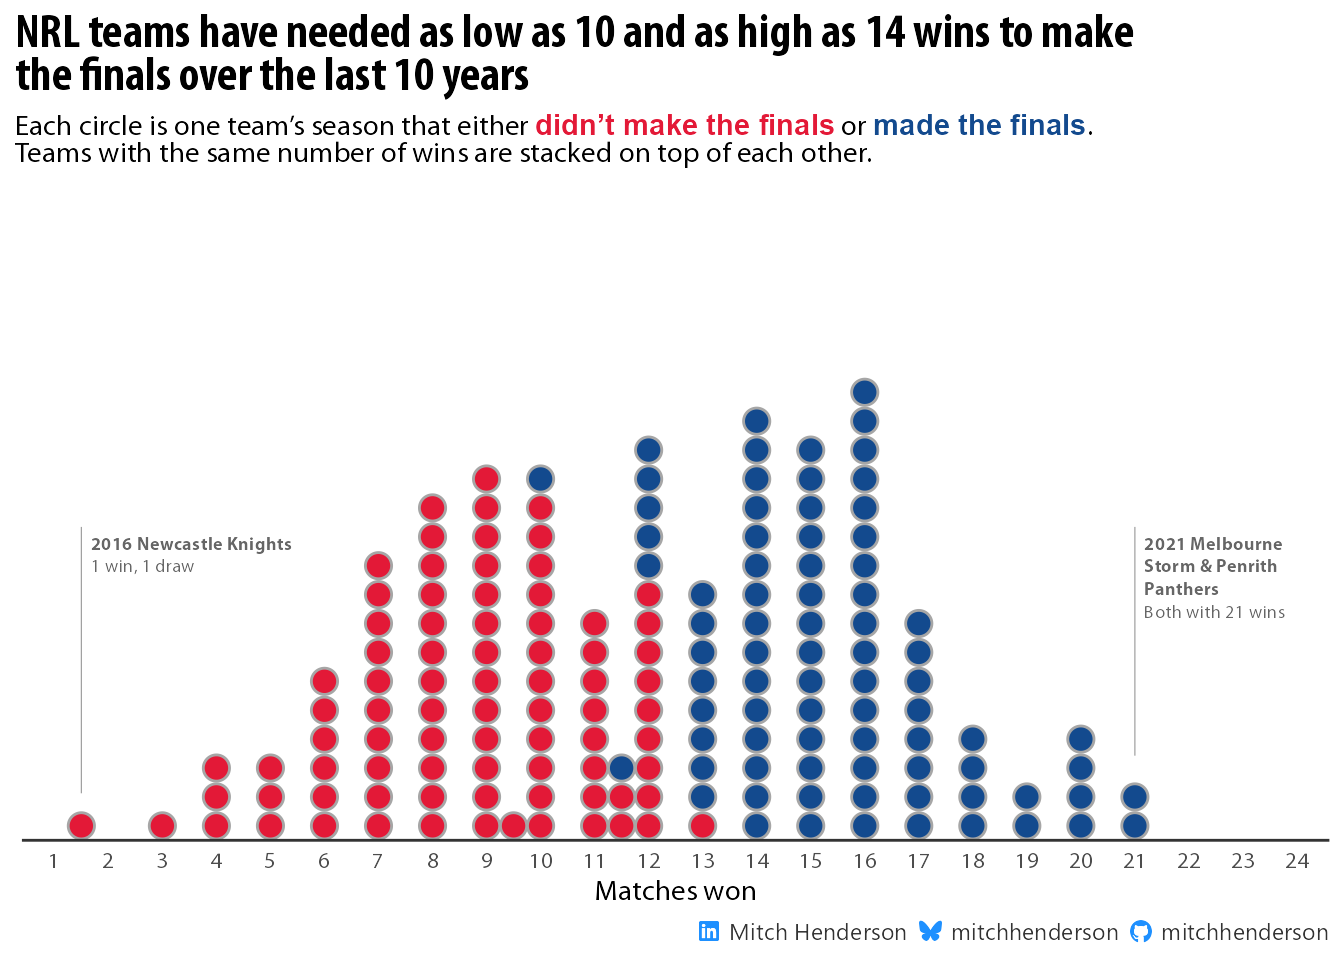
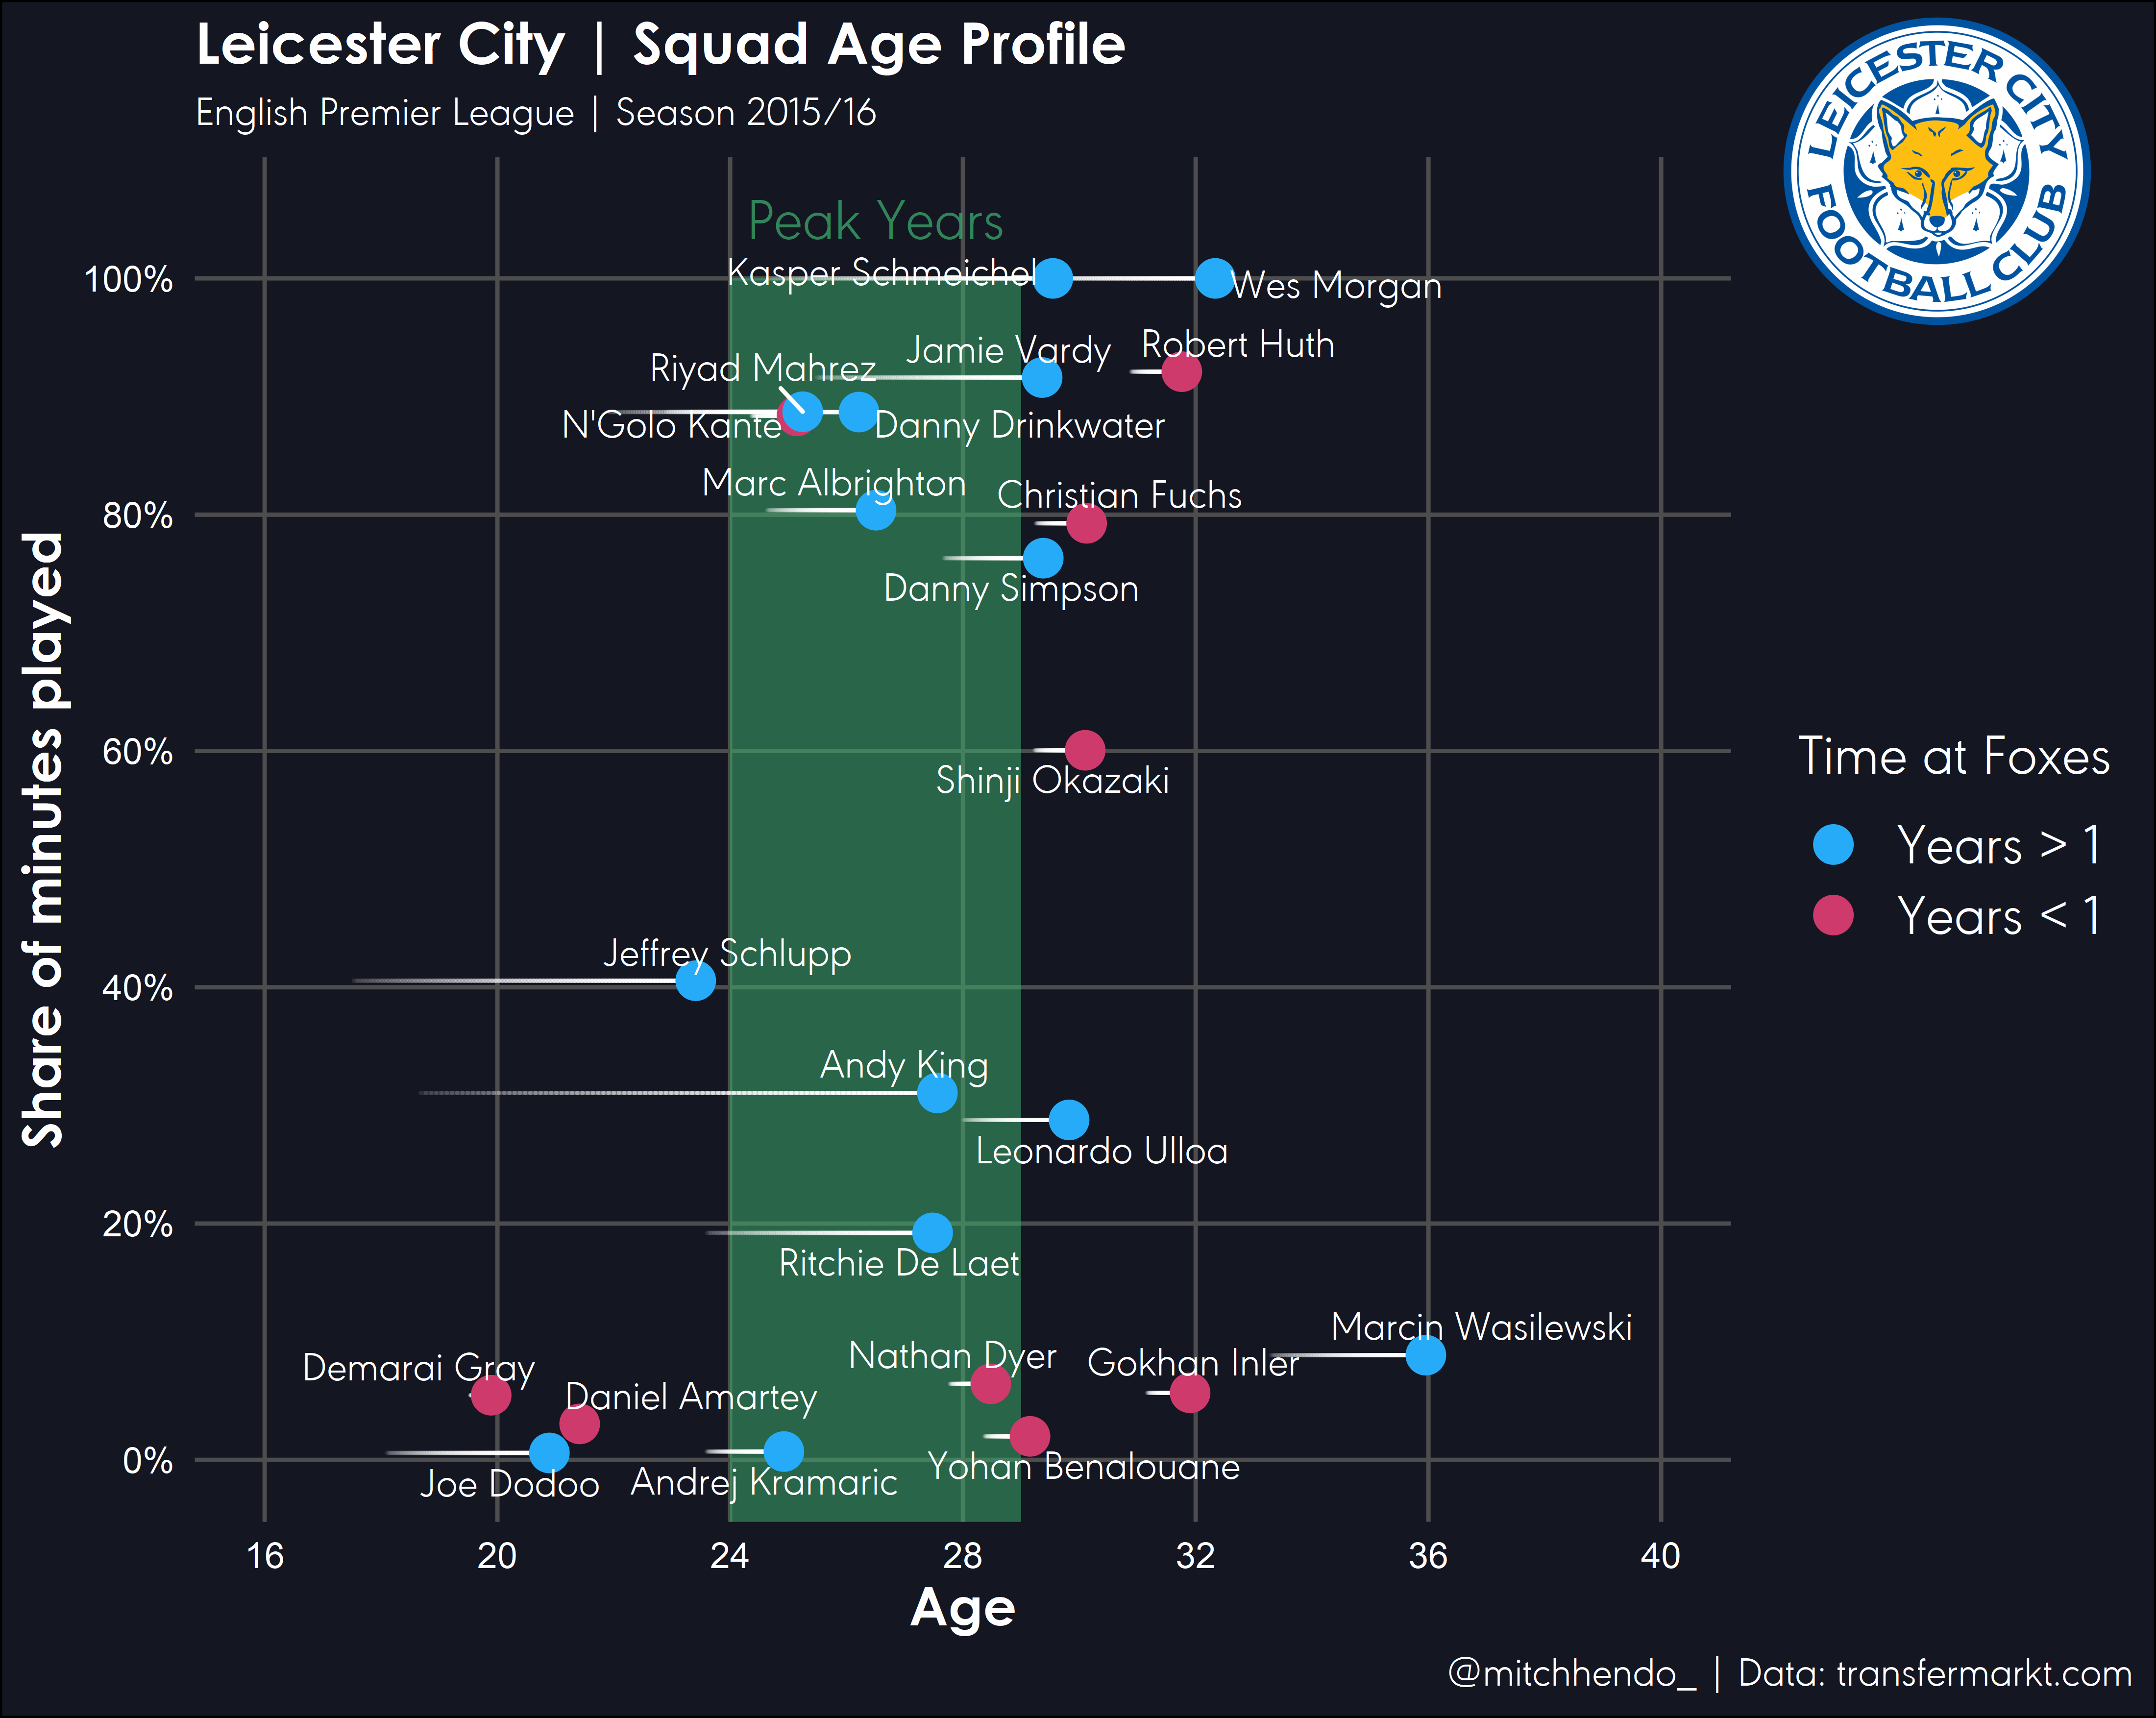
Great visualisations help communicate your message more clearly. This post shows you an example of my process.
The export format of Catapult’s 10Hz GPS data isn’t ideal for analysis. This post shows you how to tidy it using R.